If you can debug your ruby application depends on the version of the ruby interpreter you are using. Ruby 1.6.8 works on both Linux and Windows, 1.8.0 and 1.8.2 works also on Windows.
Open your ruby file and set a breakpoint like you would set a breakpoint in a java file
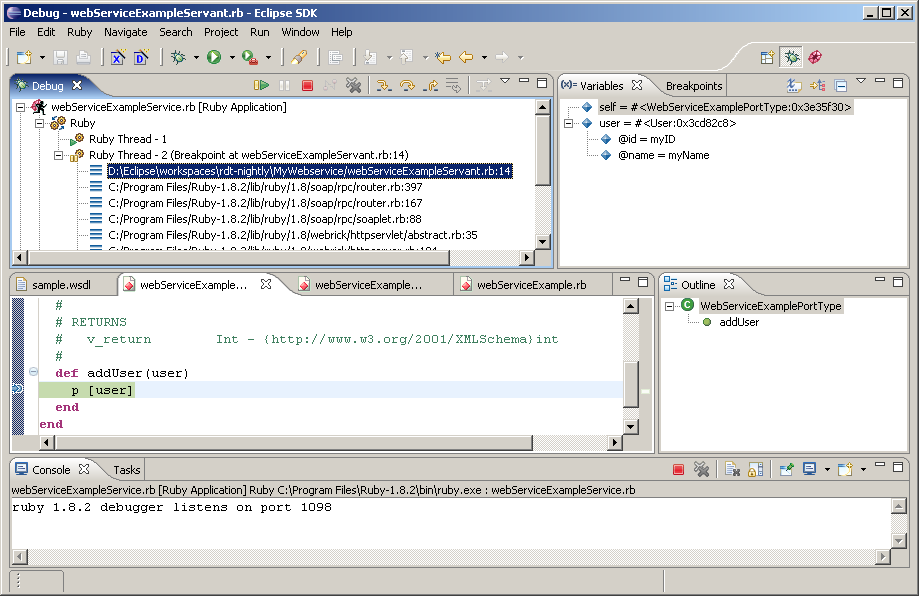
Select Run > Debug As > Ruby Application. The Debug perspective will open:
In the launch view use step into, step over, step return to step through the code. Use the resume button to resume the application.
The debug perspective contains the following views per default: Debug, Variables, Breakpoints, Editor, Outline, Console and Tasks. In addition to these there are two more view for the debug perspective: the Expression and Display view. The Expression view will be opened for displaying the results of inspect commands (runtime evaluation). The Display view allows to enter arbitrary ruby commands for evalutaion.
The variables view shows the variables available in the stack trace which is selected in the Debug view
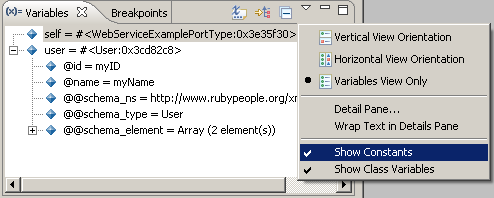
Check Show Constants to display constants, check Show Class Variables to display class variables
If you compare the default variable view with the screenshot above you will notice that there are a lot more menu commands available. They are for java debug targets. You can customize the variable view to show ruby debug commands only: Go to Window > Preferences > General > Capabilities and deselect Development. It is a little bewildering to switch off Development here, but it means only to disable Java development and not Ruby development
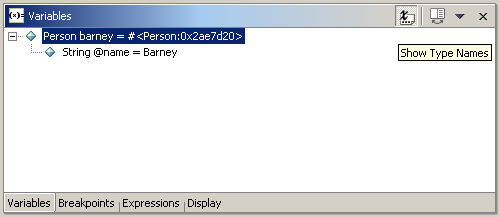
In the above screenshot there is a variable barney of type person. The object is represented by the return value of the to_s method, in this case "#<Person:0x2ae7d20>". There is one instance variable @name of type String and value "Barney".
Assume the following code:
class Person
  def initialize(name)
   @name = name
  end

  def to_s()
    return @name.to_s
  end
end

persons = []
persons << Person.new('Barney')
persons << Person.new('Moe')
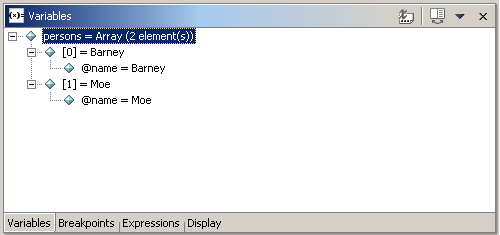
After the last assignment the variable view shows the content of the array. Note that the name appears as description for the object, because to_s is overriden.
In order to show how hashes are presented in the variables view, a hash is created:
persons = Hash[ Person.new('Lisa') => Person.new('Marge'),
                            Person.new('Maggie') => Person.new('Marge')]
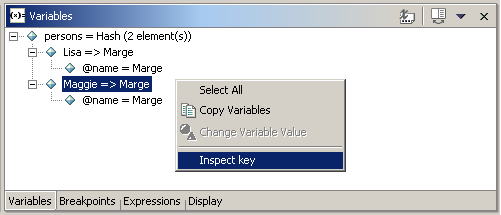
The view shows the name of the hash with the number of elements in the first place. If you expand the item, there will be a line for every key/value pair in the hash. Expanding a key/value pair will show the content of the value. If you want to know more about the key, select "Inspect key" from the context menu:
Results of ruby expression evaluation are displayed here. Evaluation takes place:
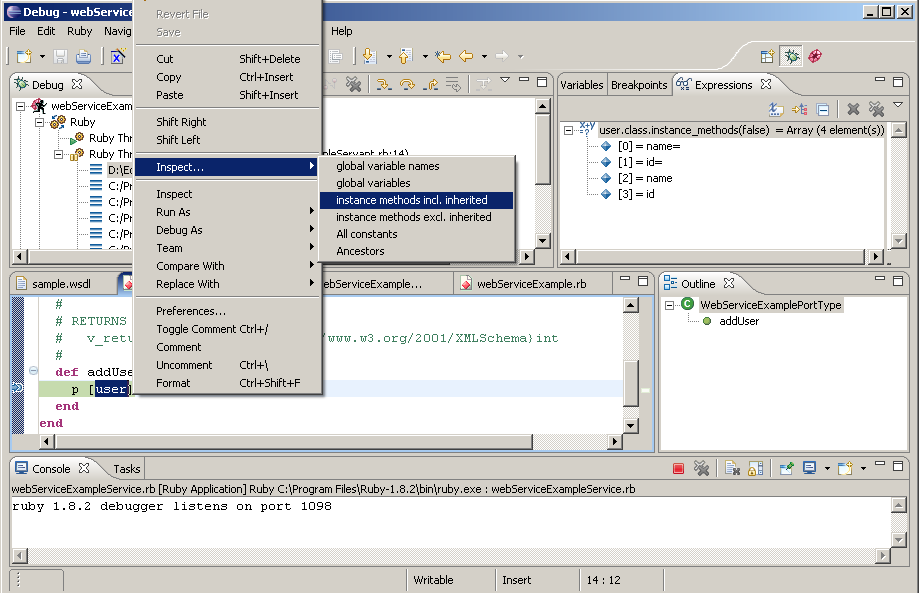
If you select text in the editor, open the context menu and run "Inspect" or a quick inspect expression with "Inspect..."
If you use the display view to enter ruby expressions
If you select "inspect key" in the context menu of a hash value in the variable view
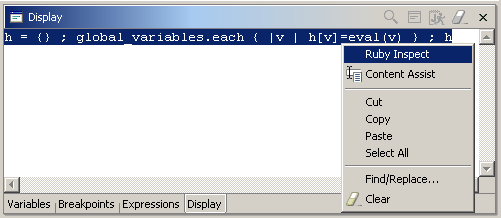
Enter your text in the Display view and run "Ruby inspect" from the context menu. The Expression view will open and show the resitemizedlistt of the expression. The expression is evaluated in the context of the selected stack frame in the Launch view.
The following example shows an expression which creates a hash with all global variables mapped to their values (the "Content Assist" menu entry is only valid in the context of a java program):
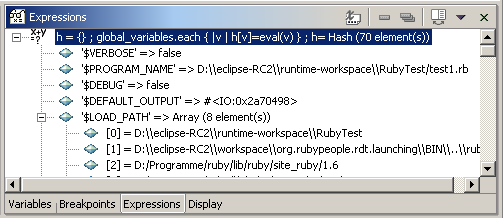
The Expressions view shows the resitemizedlistt:
If there is a debug session every file you edit and save will be reloaded from the interpreter. This allows to debug and change a ruby application without restarting. While this is a convenient feature, there are some drawbacks to consider:
The code reload does not affect the current stack trace. The current stack frame will not be reentered and will be finished with the old code. So, if you change the code of a method this method will be finished with old code and the next call to this method will use the new code. That means that Drop to Frame functionality is not available.
The interpreter reloads the file with the updated content and therefore also executes the code at the main level. That might turn the application in an undesirable state.
You cannot delete methods by reloading.
In a debug session the display view allows to enter arbitrary expressions and have them evaluated. Inspection shortcuts are a more convenient way to evaluate frequently used expression. They can be applied directly to a selection in the editor without using the Display view. The shortcuts are defined in Preferences->Ruby->Evaluation Expressions. There you can create, delete and modify expressions. Every expression has a name, description and ruby code. The ruby code may contain the placeholder %s which will be replaced with the selection before evaluation. There are some examples in the following table.
Table 3.1.
| name | ruby code | explanation |
|---|---|---|
| Global variables | h={}; global_variables.each { |v| h[v] = eval(v) }; h | This is an expression without context |
| instance methods incl. inherited | %s.class.instance_methods(true).sort | In this expression %s will be replaced with the current selection in the editor |
See Figure 3.19, “Expression view with result from quick inspect” for an usage example.
If there are exceptions in a ruby library file, the program halts there and the ruby file is opened read only. That is because the library file is not part of the eclipse workspace. In order to edit such a file, a ruby project can be created upon the library directory:
Select New > Project > Ruby Project
Enter project name, e.g site-ruby
In the section Project contents deselect Use Default and enter the directory, e.g /usr/local/lib/site-ruby/1.6. Note, that there must be write access to that directory, because eclipse wants to create a .project file.
The ruby debugger is still under development and there are some limitations, which must be considered when debugging your application:
In order to get the debug information about the running program, eclipse starts a ruby debugger before the execution of your application and talks to that ruby debugger via socket. Currently this socket is set to 1098 and if this socket is bound already debugging is not possible. (The java debugger searches for a free socket before; that behaviour should be implemented for the ruby debugger as well)
Threads are not refreshed regularly, i.e. you do not see the threads your application creates before a breakpoint (or exception or end of step) is reached
Only one ruby program can be debugged concurrently (there is a socket bind exception if you try to debug more than on ruby program at the same time)
Breakpoints are not saved when eclipse is closed
In order to provide useful information in case of errors, you shoitemizedlistd turn on verbose mode for the ruby debugger:
